J Ayub Med Coll Abbottabad 2003;15(1)
Effect of chronic tobacco use on SALIVARY concentrationS of sodium and Potassium
Ghulam Jillani Khan, Rashid Mehmood, Salah-ud-Din, Ihtesham-ul-Haq
Department of Physiology, Khyber Medical College Peshawar.
Background: Most of the methods of tobacco are use linked to the oral cavity where the taste receptors, a primary site for stimulation of salivary secretion, are constantly exposed to tobacco. It is generally believed that repeated exposure of a receptor to a stimulus results in inactivation (suppression) of the receptor. The present study was designed to document changes in salivary concentrations of sodium (Na+) and potassium (K+) in response to this effect in chronic tobacco users. Methods: Subjects of the study were divided into smokers, pan (tobacco-betel-lime quid) chewers, niswar (moist oral snuff) differs and non tobacco users as controls. The saliva of each subject was collected under resting condition and following application of crude nicotine and citric acid solutions to the tip of his tongue. Results: After stimulation with nicotine all groups exhibited an increase in sodium concentration but the increase was significant (p<0.05) in pan chewers only. However all groups showed a highly significant (p<0.005) increase in sodium concentration after citric acid stimulation. No statistically significant (p>0.05) decrease in potassium concentration was observed in any group after nicotine stimulation but all chronic tobacco user groups showed a highly significant (p<0.005) decrease after citric acid stimulation. Conclusion: We conclude the sodium concentration increases and that of potassium decreases with the increase in salivary flow rates and this observation in chronic tobacco users was not much different from that in non tobacco users.
Keywords: Saliva, tobacco, sodium, potassium.
Introduction
Chronic use of tobacco is causally linked to a variety of serious diseases ranging from coronary artery disease to lung cancer1 but no population has given up one form of tobacco use without replacing it with another2. The traditional methods of its use are smoking, chewing, dipping and snuffing. Except snuffing, the other three methods are directly linked oral cavity. It has been discovered that smoking increases the activity of salivary glands and, indeed, this observation has been made by every one who begins smoking. It has also been observed that some tolerance develops to the salivary effects of smoking because habitual smokers do not salivate as do novice smokers in response to smoking3.
It was noted that tobacco-betel-line ‘quid’ chewers secreted more saliva with levels of sodium and potassium lower as compared to non chewers on chemical but not on mechanical stimulation. This was because that chronic tobacco-betel-lime ‘quid’ chewing induces excessive secretion of more watery saliva leading to a concomitant decrease in enzyme and electrolyte contents4.
In normal individuals saliva is secreted in two stages; first, secretion occurs into the glandular acini which is approximately similar to ECF, then this primary secretion flows through the acinar ducts where reconditioning occurs, sodium is actively reabsorbed and potassium is actively secreted but with a slower rates. During maximal salivation, there is not much time for the reconditioning process to occur, therefore, sodium concentration in saliva increases while that of potassium decreases5. In edition, the differences in the function of execration and the role of excretory duct cells are currently unknown in salivary glands6. The aim of the study was to observe this effect in chronic tobacco users, where the taste receptors, a primary site for stimulation of salivary secretion, are constantly exposed to tobacco for a long period of time.
material and methods
The subjects were selected from the students of Basic Medical Sciences Institute (BMSI), Jinnah Post-graduate Medical Centre (JPMC) and the general population of Karachi.
The subjects were divided into smokers, pan (tobacco-betel-lime quid) chewers, niswar (moist oral snuff) dippers and non-tobacco users as controls. Each group was comprised of 20 apparently healthy male adults. All the subjects were well matched with respective to age (25–30 years) and the duration of beginning tobacco use (5–7 years). Subjects in the habit of more than one type of tobacco use or bad orodental hygiene or with too little salivary secretion were not included in the study.
Before sampling, each subject was briefed about the procedure and instructed to wash his mouth and gargle with plain water. The saliva of each subject was collected (for 10 minutes) under resting condition and following application of crude nicotine solution (50 mL of 1% v/v) and citric acid solution (50 mL of 1% w/v) to the tip of his tongue. Crude nicotine was extracted from tobacco7 and citric acid was obtained from the Physiology Department of BMSI, JPMC Karachi. The concentrations of sodium and potassium were determined by flame photometer (model Gallenkamp FH-500)8,9 as described by Levinson and Mac Fate, 1961 and Raphacl, 1976. The data was statistically analyzed by Student’s t-test10,11.
results
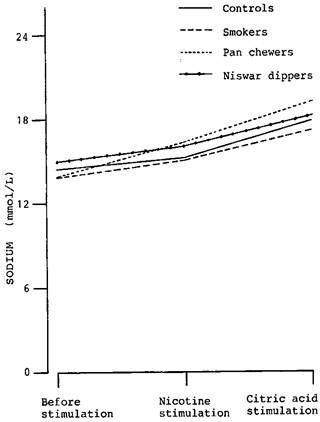
The concentration of sodium in the unstimulated whole saliva was not statistically significant (p>0.05) when the chronic tobacco user groups were compared with controls. Following stimulation with nicotine, the concentration of sodium showed an increase in all groups.
Table-1: Comparison of salivary sodium concentration (mmol/L) of controls, smokers, pan chewers and niswar dippers, before and after stimulation with 50 mL of 1% (v/v) crude nicotine and 50 mL of 1% (w/v) citric acid
|
Salivary sodium concentration (mmol/L±SE |
|||
Group |
Before stimulation |
Following Stimulation with |
|
|
Nicotine |
Citric acid |
||
|
Controls |
14.45 ± 0.43 |
15.10±0.35 (4.50%) |
17.85±0.44 (23.53%)** |
|
Smokers |
13.80 ± 0.54 |
14.90±0.66 (7.97%) |
17.15±0.76 (24.78%)** |
|
Pan chewers |
13.80 ±0.83 |
16.15±0.86 (17.03%) ** |
19.15±1.07 (38.77%)** |
|
Niswar dippers |
14.90 ±0.74 |
16.05±0.79 (7.72%)** |
18.20±0.94 (22.15%)** |
Percent increase is given in parenthesis.
*p<0.05 and **p<0.05 as compared with its mean value before stimulation.
The increase in the concentration of sodium in the saliva of controls (4.50%), smokers (7.97%), pan chewers (17.03%) and niswar dippers (7.72%) was statistically significant (p<0.05) in pan chewers only. There was no statistically significant difference (p>0.05) in any group of chronic tobacco users when they were compared with controls.
After stimulation with citric acid, the concentration of sodium rose further. The increase in the concentration of sodium in the saliva of controls (23.53%), smokers, (24.78%), pan chewers (38.77%) and niswar dippers (22.15%) was highly significant (P<0.005) in all groups. However, no statistically significant difference (P>0.05) was seen in any group of the chronic tobacco users when they were compared with controls.
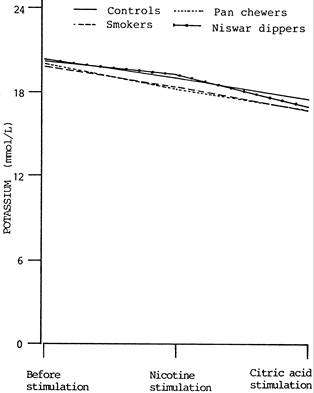
The concentration of potassium in the unstimulated whole saliva was not statistically significant (p>0.05) when the chronic tobacco user groups were compared with controls.
Following stimulation with nicotine, the concentration of potassium showed a decrease in all groups. The decrease in the concentration of potassium in the saliva of controls (6.85%), smokers (7.05), pan chewers (8.79%) and niswar dippers (7.45%) was not statistically significant (p>0.05) in any group and no significant difference (p>0.05) was observed when the chronic tobacco users were compared with controls.
After stimulation with citric acid, the concentration of potassium dropped, further. The decrease in the concentration of potassium in the saliva of controls (13.94%), smokers (15.11%), pan chewers (16.08%) and niswar dippers (18.03%) was not statistically significant (p>0.05) in controls but highly significant (p<0.005) in all groups of chronic tobacco users. However, no statistically significant difference (p>0.05) was observed when the chronic tobacco user groups were compared with controls.
Table–2: Comparison of salivary potassium concentration (mmol/L) of controls, smokers, pan chewers and niswar dippers, before and after stimulation with 50 mL of 1% (v/v) crude nicotine and 50 mL of 1% (w/v) citric acid
|
Salivary sodium concentration (mmol/L±SE |
|||
|
Group |
Before stimulation |
Following Stimulation with Nicotine Citric acid |
|
|
Controls |
20.45±1.28 |
19.05±1.28 (6.85%) |
17.60±1.17 (13.94%) |
|
Smokers |
19.85±0.74 |
18.45±0.80 (7.05% |
16.85±0.77 (15.11%)* |
|
Pan chewers |
19.90±0.87 |
18.15±0.75 (8.79%) |
16.70±0.65 (16.08%)* |
|
Niswar dippers |
20.80±0.80 |
19.25±0.81 (7.45%) |
17.05±0.90 (18.03%) |
Percent increase is given in parenthesis.
*p< 0.005 as compared with its mean value before stimulation.
Figure-1:
Changes in salivary sodium level of controls, smokers, pan chewers and niswar
dippers, following stimulation with 50
mL
of 1% (v/v) crude nicotine and 50
mL
of 1% (w/v) citric acid
Figure–2: Changes in salivary potassium level of controls, smokers, pan
chewers and niswar dippers, following stimulation with 50
mL
of 1% (v/v) crude nicotine and 50
mL
of 1% (w/v) citric acid
discussion
It is generally accepted that salivary secretion is a two stage operation, the first stage involves the acini which secrete a primary secretion and this secretion is not much different from the extracellular fluid, and the second stage involves the ducts where reconditioning of the primary secretion occurs. When the primary secretion flows through the ducts, sodium is absorbed and potassium is secreted. During maximal salivation, the ductal reconditioning is considerably reduced resulting in increased sodium and decreased potassium levels in saliva5. In a study it was noted that the concentration of sodium in the stimulated whole saliva was directly proportional to the rate of secretion whereas the concentration of potassium showed a slight but insignificant change12. Moreover it was also concluded that whereas the concentration of sodium in saliva rises with increasing rate of stimulation, the concentration of both potassium and calcium are substantially independent of the rate of secretion. However, there is an increase in potassium concentration at very low rates13. In a study two distinct phases of salivary composition following stimulation of the motor nerve to the parotid gland; phase I, lasting for first two minutes, was characterized by a rise, a fall and a subsequent further rise of sodium concentration and a roughly reciprocal change in the potassium concentration and phase II, which was characterized by the fact that for each ion, the composition of saliva was related to the rate of secretion14. It is also been concluded that submandibular secretory responses to electrical stimulation of the parasympathetic innervation can be significantly attenuated by reducing blood flow through the gland15.
The present study in this regard, mainly follows the observations made by most of the above authors. Following stimulation, the sodium concentration showed an increase while that of potassium a decrease. The increase in the sodium concentration was significant in case of pan chewers only following stimulation with nicotine but highly significant following citric acid stimulation in all groups. These observations clearly demonstrate that the sodium concentration increases as the flow rate increases because citric acid induces more flow of saliva as compared to nicotine. Moreover, further explanation of the phenomenon is provided by the significantly increased sodium concentration in pan chewers following stimulation with nicotine because these individuals exhibit higher salivary flow rates as compared to non chewers. Some workers observed higher salivary flow rates in these individuals on chemical but not on mechanical stimulation4. However, as the flow rate is increased towards maximum, the concentration of sodium hardly alters16.
The decrease in the potassium concentration was significant in all the chronic tobacco users but not in controls following stimulation with citric acid. If the statement that the concentration of both potassium and calcium are independent of the rate of salivary secretion13, is accepted, then the significant decrease in the potassium in all the chronic tobacco users can not be explained wholly solely on the increased flow rates of saliva after stimulation. It was further said that upon stimulation, the previously inactive gland loses potassium into the blood as well as into the saliva. Subsequently the gland extracts potassium from the blood to maintain its output to the saliva13. One possibility for this decreased potassium level can be that the extraction of potassium from the blood into the saliva becomes weaker and weaker as the flow rate increases in the chronic tobacco users. Moreover, changes in the potassium are slight over a wide range of flow rates in pan chewers16. We also found similar lower potassium levels in pan chewers as compared to controls but the differences were insignificant.
An unsocial habit (although this observation was not part of the study) of pan chewers and niswar dippers is that they repeatedly expectorate and spit copious quantities of saliva to the exterior. This not only spoils the social atmosphere of non-users17 but also results in loss of huge amount of electrolytes including sodium and potassium (more serious) to the exterior. Therefore, the authors are of the view that the study may be extended to find out a definite correlation, if any, between saliva loss and plasma sodium and potassium concentration.
REFERENCES
1. Jaffe JH. Drug addiction and drug abuse. In Gilman AG, Goodman LS, Rall TW, Murad F. (Eds). Goodman and Gilman’s, The Pharmacological Basis of Therapeutics. MacMillan Publishing Co. New York. 1985:532-581.
2. Russel MAH, Jarvis MJ, Feyerabend C. A new age for snuff. Lancet 1980; 1:474-475.
3. Larson PS, Haag HB, Silvette H. Tobacco, Experimental and Clinical Studies. The Williams and Wilkins Company. Baltimore. 1961.
4. Reddy MS, Naik SR, Bagga OP, Chuttani HK. Effect of chronic tobacco-betel-lime ‘quid’ chewing on human salivary secretions. Am J Clin Nutr 1980;33:77-80.
5. Guyton AC, Hall JE. In:Textbook of Medical Physiology. Harcourt A Health Sciences Company. Philadelphia. WB Saunders and company. 738-753.
6. Utematsu T, Yamaoka M, Matsuurat T, Doto R, Hotomi H, Yamada A et al. D. P-glycoportien expression in human major and minor salivary glands. Arch Oral Biol 2001; 46:521-527.
7. Pavia DL, Lampman GM, Kriz Jr GS. Introduction to Organic Laboratory Techniques, A Contemporary Approach. WB Saunders Company. Philadelphia, 1976:46-54.
8. Levinson S A, Mac Fate RB. Clinical laboratory diagnosis. Lea & Feibiger. 1961:129-140.
9. Raphael SS. Lynch’s Medical Laboratory Technology. W. B. Saunders Company. Philadelphia. 1976:90-94.
10. Chaudhry SM. Introduction to statistical theory (Part 2). Ilmi Kitab Khana. Lahore. 1985:167-206.
11. Ganong WF. Review of Medical Physiology. Medical Books/McGraw-Hill Medical Publishing Division. California. 2001:714-716.
12. Zipkin I, Bullock FA, Mantel N. The relation of salivary sodium, potassium, solids and ash concentration to dental caries experience in children 5 to 6 and 12 to 14 years of age. J Dent Res 1957; 36:525-531.
13. Burgen ASV. The secretion of potassium in saliva. J Physiol 1956;132:20-39.
14. Coats DA, Wright SU. Secretion by the parotid gland of sheep. The relationship between salivary flow and composition. J Physiol 1957; 135:611-622.
15. Rourke K, Edwards AV. Submandibullar Secretory and vascular responses to stimulation of parasympathetic in anaesthetized cats. J App Physiol 2001;89:1964-1970.
16. Schneyer LH, Young JA, Schneyer CA. Salivary secretion of electrolytes. Physiol Rev 1972;52:720-777.
17. Goldsmith D F, Winn D M. Hazards with snuff. Lancet 1980;1:825
Address for Correspondence:
Dr. Ghulam Jillani Khan, Assistant Professor, Department of Physiology, Khyber Medical College Peshawar, Pakistan.