Introduction
Non Hodgkins Lymphoma (NHL) are a diverse group of neoplasms both in
their natural history and in their response to treatment. They rank fifth in
cancer incidence in United States, and are increasing at a rate of almost 7%
per year.1 Available epidemiological data from various parts of Asia
indicate marked geographical variation in the incidence, histopathologic and
clinical behavior of NHL.2-5 NHL appears to be more common in
developing countries6,7 where a combination of environmental,
infectious and genetic factors affect the development of these disorders. in Northern Pakistan8 NHL
is the most common cancer in males while it is the sixth most common cancer in
females.
The International Prognostic Index (IPI)9 has
been specifically developed by the International lymphoma task force to predict outcome in patients
with aggressive non-Hodgkin’s lymphoma based on pretreatment clinical features
which include age, disease stage, performance status, LDH, number of extra
nodal sites. However data on the applicability of IPI on DFS and OS from
developing countries is scarce.
It has been suggested that socioeconomic status is an
important prognostic factor for survival differences in third world countries10.
No information is available correlating socio economic status(SES) with
survival in patients with NHL.
MATERIAL AND Methods
We conducted a data base analysis on two hundred and nineteen
patients with aggressive non-Hodgkin’s lymphoma treated with doxorubicin based
chemotherapy presenting to our Department from August 1998 to July 2000 to
determine the applicability of the IPI. The patients were classified into three
different prognostic groups. Treatment outcomes were analyzed and OS and DFS
were calculated. Correlation of SES and overall survival were done.
Staging Workup
All patients
underwent an initial staging workup according to the Ann Arbor System. This
included a complete hematological, renal and hepatic profile, serum lactic
dehydrogenase (LDH), and uric acid.
Serological HIV testing was performed at the time of diagnosis.
Radiological investigations included chest X Rays, abdominal and pelvic
ultrasounds, and CT/MRI scans. In case of gastrointestinal symptoms upper GI
series with small bowel follow through or barium enema were carried out.
Bilateral bone marrow aspirates and biopsies were done on all patients.
Histopathologic diagnosis was made on the basis of International Working
Formulation. SES was determined by economic characteristics.
annual
Income of household (US$<1000=Low, US$>1000=High)11
Chemotherapy protocols
All patients
received doxorubicin based chemotherapeutic regimens, which included CHOP (Cytophosphamide
750 mg/m2 IV day 1, Doxorubicin 50 mg/m2 IV day 1,
Vincristine 1.4 mg/m2 IV day 1 , Prednisone 100 mg/d PO days 1-5).
Radiotherapy was given for bulky disease (>10 cm).
Response criteria
Response
categories are defined by the standardized response criteria for NHL12.Complete
remission is defined as the disappearance of all clinical evidence of active
tumor for a minimum of four weeks. Partial remission is a decrease of more than
50 percent in the sum of the products of the maximal perpendicular diameters of
the measured lesions, lasting at least four weeks. Disease progression is
indicated by the appearance of new lesions or by a 25 percent increase in the
size of preexisting lesions.
International
Prognostic Index
All patients
were evaluated for pretreatment clinical features predictive for
disease-free and overall survival. These included age, PS, LDH,
stage, and number of extranodal disease sites. A patient's relative
risk of death was calculated by adding the number of adverse
prognostic factors present at diagnosis. Three groups of patients
with similar relative risk, low (zero to one adverse factor),
intermediate (two adverse factors), high risk (three to five adverse factors) were
identified.
For patients under 60 years, the age-adjusted index was
applied based on stage, PS and LDH.
Statistical Analysis
All the data
entry and statistical analysis was done using Microsoft Access, Excel (office
2000 version) and SPSS (version 10.1.0) database software.
Overall survival and disease free survival were estimated with
Kaplan and Meier method. Log rank statistical significance was applied to
overall survival in different risk groups.
Results
Clinicopathological
characteristics and socioecono-mic status of these patients are given in Table
1. Median age of our patients was 42 years. Male female ratio was 2.26:1.
Majority of our patients belonged to Stage III and IV(76%). Primary extranodal
involvement was present in 32% of cases. Bone marrow was the most common
extranodal site involved. Other extranodal
sites were CNS (07%), gastrointestinal tract (19%),abnormal LDH was present in
(65.3%). %). No patient tested HIV positive on initial investigations. Mean
duration of symptoms before diagnosis was 6.8 months.78% of patients belonged
to poor socio-economic status.
 Table 1: Characteristics of 219 patients presenting with Aggressive NHL.
|
Characteristics
|
No.
|
(%)
|
Sex
|
|
Male
|
152
|
70
|
|
Female
|
67
|
30
|
Age
|
|
≤60 yr
|
170
|
78
|
|
≥60yr
|
49
|
22
|
Ann Arbor Stage
|
|
I
|
15
|
07
|
|
II
|
36
|
17
|
|
III
|
40
|
18
|
|
IV
|
128
|
58
|
Presentation
|
|
Nodal
|
150
|
68
|
|
Extranodal
|
69
|
32
|
Symptoms
|
|
Fever
|
135
|
62
|
|
Weight loss
|
122
|
56
|
|
G. I symptoms
|
59
|
27
|
Lymphomatous
involvement
|
|
Spleen
|
103
|
47
|
|
Bone Marrow
|
102
|
47
|
|
Liver
|
50
|
23
|
|
Gastroinestinal
tract
|
41
|
19
|
|
CNS
|
16
|
07
|
|
Others( lung,
bones, kidney etc)
|
58
|
27
|
LDH
|
|
1, Normal
|
45
|
20)
|
|
2, Abnormal
|
143
|
65)
|
|
9, Not known
|
31
|
14)
|
Extra nodal involvement
|
|
|
|
1 site
|
71
|
32
|
|
2 or > 2
sites
|
121
|
55
|
Performance
Status
|
|
0-1(fully active, ambulatory)
|
93
|
42
|
|
2,3,4 ( 50%,>50% and completely bed
ridden)
|
119
|
54
|
|
9 Not known
|
7
|
03
|
Social status
|
|
1, High
|
41
|
22
|
|
2, Low
|
142
|
78
|
Table 2: Out come
According to Risk Group Defined by the International Prognostic Index and the
Age-Adjusted International Index
|
Risk Group
|
No. of Risk Factor
|
No. of Patients %
|
Complete Response
Rate %
|
Disease free Survival
|
Overall Survival
|
|
2 yr
Rate %
|
5 yr
Rate %
|
2 yr
Rate %
|
5 yr Rate %
|
|
International Index, all patients (n=197)
|
|
Low
|
00r 1
|
15
|
72
|
66
|
66
|
69
|
64
|
|
Intermediate
|
2
|
21
|
55
|
43
|
43
|
51
|
46
|
|
High
|
3 to 4
|
64
|
38
|
34
|
18
|
32
|
13
|
|
Age Adjusted Index, Patients 60 yrs (n=164)
|
|
Low
|
0 0r 1
|
16
|
76
|
70
|
63
|
71
|
64
|
|
Intermediate
|
2
|
24
|
60
|
45
|
45
|
52
|
46
|
|
High
|
3 to 5
|
60
|
44
|
40
|
19
|
34
|
11
|
|
|
|
|
|
|
|
|
|
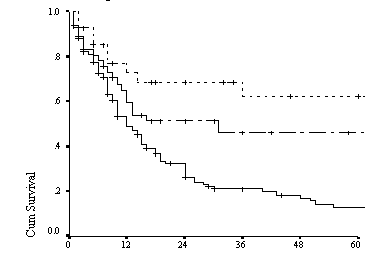
DFS
High _______ ,
 Intermediate
Low -----------
Figure 1: Kaplan Meier curve for disease free survival
of all ages according to risk group defined by
IPI(n=91)
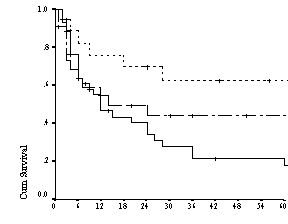
Overall Survival
High _______
Intermediate
Low -----------
Log rank Statistical
significance for IPI grades is p= .0008
Figure 2: Kaplan Meier curve for Overall Survival patients
of all ages according to risk group defined by the IPI(n=197)
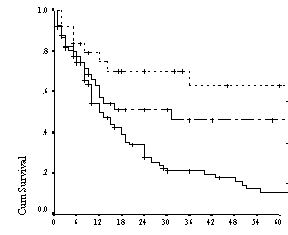
Disease
Free Survival
High _______
Intermediate
Low -----------
Figure 3: Kaplan Meier curve for disease free survival
among younger patients ( ≤ 60 yrs)
according to risk group defined by the Age Adjusted IPI(n=87)
OS
of all patients according to SES
High _______
Intermediate
Low -----------
Log rank statistical
significance for IPI grade is p= .0013
Figure 4:Kaplan Meier curve for overall survival
among younger patients ( ≤ 60 yrs)
according to risk group defined by the Age Adjusted IPI(n=164)
Overall
Survival of all patients according to SES
High _______
Low-----------
Log rank
test and significance p= 0.009
Figure 5: Kaplan Meier
curve for overall survival of all patients according to socioeconomic status.
Overall
Survival according to International Prognostic Index:
One hundred and
ninety seven patients could be assessed for overall survival of all ages.
Twenty-two patients were lost to follow up. The predicted two and
five-year survivals of the three risk groups, low (no or one risk factors),
intermediate (two risk factor) and high (three or more risk factors)
were 69%, 51%, 32% and 64%, 46%, and 13% respectively (Table 2 and figure 2).
The survival difference is significant in different risk groups stratified
according to IPI (p=0.0008)
Disease Free survival
Complete
response was achieved in 46% of the patients. Complete response rates according
to low, intermediate and high groups among all patients were 72, 55 and 38%
(table2). The two and five year disease free survival among these patients were
(66%), (43%),(34%) and (66%),(43%),(18%) as shown in (table 2,figure 1).
In age adjusted group (≤
60) complete response obtained according to defined risk groups were 76.6% and
40% as depicted in table 2. The two and five year DFS among these patients were
(70%),(45%),(40%) and (63%), (45%) (19%) respectively. (table 2, figure 3)
Accurate
assessment of survival in patients ≥ 60 yrs could not be done due to
small sample size (n=33).
Discussion
A number of studies have been identified risk factors that carry
independent prognostic significance thereby identifying patients requiring
different therapeutic approaches.13-18 The IPI has now become a
standard prognostic factor model for aggressive lymphomas with doxorubicin
containing regimens in Europe and North America19,20.
In contrast little information is available from developing
countries where advanced disease, B symptoms and aggressive lymphomas are more
frequent.21-23 Disease
free survival and overall survival data is also limited with majority of
patients being lost to follow up24.
Modifications of the IPI have been made by researchers from developing
countries. Chinese investigators have divided their patient population into
three risk groups low, intermediate and high25,26. Mok et al further
found that the IPI was applicable to their patient population despite high
numbers of primary extra nodal lymphomas27. Investigators from
Brazil28 have also condensed the four categories of IPI into two
groups of low and high risk due to missing data, which is a frequently
encountered problem in developing countries.
Clinico-pathological analysis of our patients revealed
data similar to other developing countries. Seventy-five percent of our
patients were below 60 years. Poor performance status, advanced disease and
extranodal involvement ≥2 were present in more than 50%. We divided the
patients in two groups, one group for all ages and second for patients who are
60 years or less. The sample size for patients over 60 years (n=33) was too
small to accurately predict survival (n=33). We classified our patients into
three risk groups Low (0,1), intermediate(2) and high (3 to 5).
Two and five year’s disease free and overall survival of
all patients as seen in Figure 1&2 are accurately predictive of DFS and OS
according to risk groups. Our results are inferior due to multiple factors
including poverty, illiteracy, malnutrition and repeated infections9.
Lack of trained personnel and tertiary care cancer centers do not allow easy access
to patients as a result an average patient has to travel a few hundred
kilometers before he can undergo cancer treatment. Our patients do not appreciate the concept of
dose density and intensity and average treatment delay of one week or more is
quite frequent. Other contributory factors include co-morbid conditions like
hepatitis29 and malnutrition30-32 which cause further
delays in treatment. These problems are
common to all developing countries6,21,27.
Log rank analysis done on OS were significant for all
ages p=0.0008 and for age less than 60 years where p=0.0013, thus confirming
the accuracy of predicting prognosis by applying IPI on our patient
population. Our results are superior to
that reported from Brazil where overall survival rates were only 44% and 17% in
low and high risk groups. Our overall five year survival for intermediate and
high risk groups (46 and 13% ) respectively is also superior to the results
reported by Yong et al ( 21.6 and 7.4%)25.
In our series we found SES was an important predictor
for survival. Patients belonging to high socioeconomic status had superior
outcome as compared to low socioeconomic group. Log rank analysis for two
socioeconomic group difference is p= 0.009 similar to observations made
by investigators from India and Brazil10,32. we
are unable to compare SES and survival outcomes for each IPI subgroup due to
small sample size.
In conclusion the clinical model of IPI accurately
identified specific patients risk groups in our patient population. New biological
and immunological variables are now substituting for clinical surrogate
features in the prognostic factors model for NHL. However in developing
countries with technical and financial constraints33 the
International Prognostic Index will continue to help us in identifying specific
risk groups and help us in modifying our treatment approaches accordingly.
References
1.
Greenlee RT, Murray T, Bolden S. Cancer statistics 2000. CA Cancer J Clin 2000; 50: 7-33.
2.
Parkin DM, Pisani P, Ferlay J. Global Cancer Statistics,1999. CA Cancer
J Clin 1999;49:33-64 .
3.
Intragumtornchai T, Wannakrairoj P, Chaimongkol B. NHL in Thailand. A
retrospective pathologic and clinical analysis of 1391 cases. Cancer
1996;78(8):1813-9.
4.
Ji X, Li W.Malignant lymphoma in Beijing. J Environ Pathol Toxicol Oncol
1992;11(5-6):327-9
5.
Chi JG, Shin SS, Ahn GH. Malignant lymphomas in Korea. Jpn J Clin Oncol
1985;15:653-7.
6.
Obafunwa JO, Akinsete I. Malignant lymphomas in Jos, Nigeria: a ten-year
study. Cent Afr J Med 1992;38(1):17-25.
7.
Jussawalla DJ, Gangadharan P. Epidemiology of Cancer in the Indian
subcontinent, series IV. Indian J Cancer 1974; 11:3-11.
8.
Ahmad M, Khan AH, Mansoor A. NHL clinicopathological pattern. J Pak Med
Assoc 1992;42:205-09.
9.
The International NHL Prognostic Factors Project. A Predictive Model for
aggressive Non-Hodgkins Lymphoma. N Engl J Med 1993;329(14):987-94.
10.
Rajajee S, Desikulu MV, Pushpa V. Survival of childhood acute
lymphoblastic leukemia: experience in Chennai. J Trop Pediatr
1999;45(6):367-70.
11.
Overview of Economic Survey 2001-2002 by the Government of Pakistan.
Dawn, June 14, 2002.
12.
Cheson B, Horning S. Report of an international workshop to standardize
response criteria for NHL. J Clin Oncol 1999;17(4):1244-53.
13.
Aydin F, Ulosoy S, Ovali E. Results of treatment with
Cyclophosphamide, Doxorubicin, Vincristine and Prednisolone(CHOP) for
non-Hodgkins aggressive lymphoma analyzed accorsing to the IPI. Journal
Chemotherapy 1997;9(6):446-51.
14.
Mounier N, Morel P, Haioun C. A multivariate analysis
of the survival of patients with aggressive lymphoma: variations in the
predictive value of prognostic factors during the course of the disease. Groupe
d’Etudes lymphomas de l’Adulte. Cancer 1998; 82(10):1952-62.
15.
Salmenin E. Age related survival in NHL. Oncology
1998;55(1):7-9.
16.
Peters FP, Haaft MA, Schouten HC. Intermediate and
high grade NHL in the elderly. Leuk Lymphoma 1999;33(3-4): 243-52.
17.
Atkins CD, Myers CD. A predictive model for NHL.
[correspondence]. N Engl J Med 1994;330(8):574-5.
18.
Lee SC, Wong JE, Kueh YK. Clinical characteristics
and treatment outcome of 218 patients with NHL in a Singaporean institution.
Singapore Med J 2000;41(3):118-21.
19.
Shipp M. Prognostic Factors in Aggressive NHL: Who Has “ High –Risk”
Disease? Blood 1994;83(5):1165-73.
20.
Phillip T, Gomez F, Guglielmi C. Long-term outcome of relapsed NHL
patients included in the PARMA TRIAL: incidence of late relapses, long-term
toxicity and impact of the international prognostic index (IPI) at relapse.
Proc Am Soc Clin Oncol 1998;17:16a.
21.
Garg A, Dawar R, Agarwal V. NHL in Northern India: A retrospective
analysis of 238 cases. Cancer 1985;56:972-7.
22.
Salem P, Anaissie E, Allam C. NHL in the Middle East, A study of 417
patients with emphasis on special features. Cancer 1986;58:1162-6.
23.
Aziz Z, Rehman A, Akram M. NHL in Pakistan: a clinical profile of 175
patients. J Pak Med Assoc 1999;49(1):
24.
Chim CS, Kwong YL, Lie AK, Lee CK, Liang R. CEOP
treatment results and validation of the International prognostic Index in
Chinese patients with aggressive NHL. Hematol Oncol 1998;16(3):117-23.
25.
Yong W, Zhang YT, Wei Y. Multivariate analysis on prognostic factors of
NHL (article in Chinese). Zhonghua Zhong Liu Za Zhi 1997;19(3):212-4.
26.
Chin Mok TS, Steinberg J, Chan AT, Yeo WM, Hui P, Leung TW, Johnson R.
Application of the IPI in a study of Chinese patients with NHL and a high
incidence of primary extranodal lymphoma.. Cancer 1998;82(12):2439-48.
27.
Biosoli I, Morais JC, Soares de Jesus P, Pulcheri W,
Nucci M, Spector N. Application of an
adopted international prognostic index for aggressive NHL: good discrimination
and lower survival rates in Rio de Janerio, Brazil. Oncol Rep 2001;8(2):441-4.
28.
Ghafoor A. An overview of research on communicable disease in Pakistan.
Proc. PMRC Med. Res. Congr., Islamabad 1984; 29-39.
29.
Ferraz EM, Gray RH, Cunha TM. Determinants of pre-term delivery and
intrauterine growth retardation in northeast Brazil. Int J Epidemiol
1990;19:101-8.
30.
Lima M, Figueira F, Ebrahim GJ. Malnutrition among children of
adolescent mothers in a squatter community of Recife. Brazil J Trop Pediatr 1990;36:14-19.
31.
Robyn C, Kieta MS, Neuris S, Intrauterine growth retardation in Africa.
In: Senterre J (ed). Intrauterine Growth Retardation. Nestle nutrition Workshop
Series 18. New York, Netsec Ltd Vevey/Raven Press 1989: pp165-181.
32.
Viana MB, Fernandes RA, de Carvalho RI, Murao M. Low socioeconomic
status is a strong independent predictor of relapse in childhood acute
lymphoblastic leukemia. Int J Cancer Suppl 1998;11:56-61
33.
World Development Report. Investing in Health. World Development
Indicators. New York, Oxford University Press, 1993.(soc. Indicators).
Address for
Correspondence:
Zeba Aziz MD, Department of Medical
Oncology, Allama Iqbal Medical College, 13/2 V Block, Phase II LCCHS, Lahore, Pakistan.
Fax: 92 42 636 8326,
E mail: azizzeba@hotmail.com